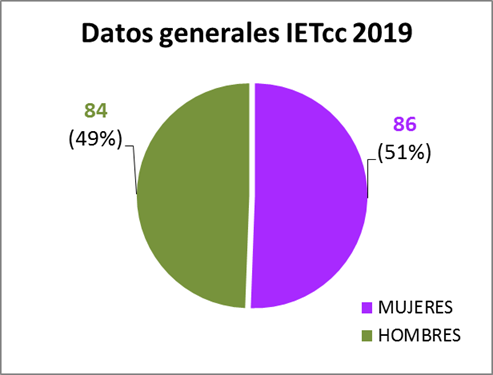
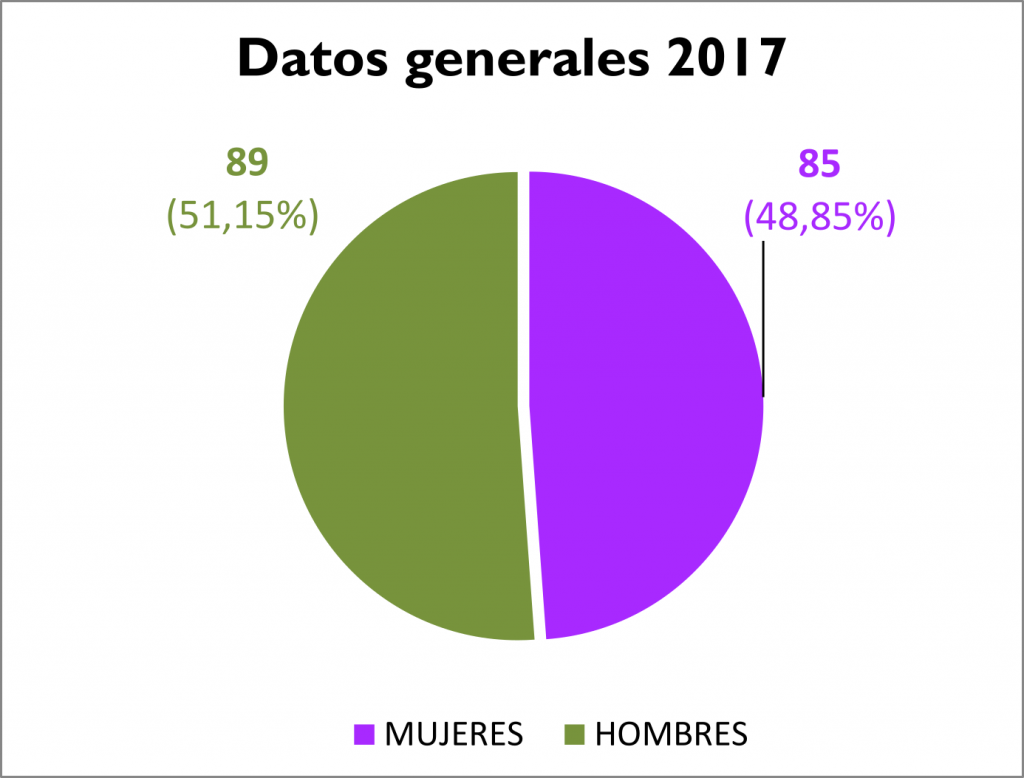
General information
For years, the IETcc has broken down the main data into statistics by gender in its annual reports. Data and figures that are detailed below correspond to IETcc situation from the year 2017 to the present


Scientific staff
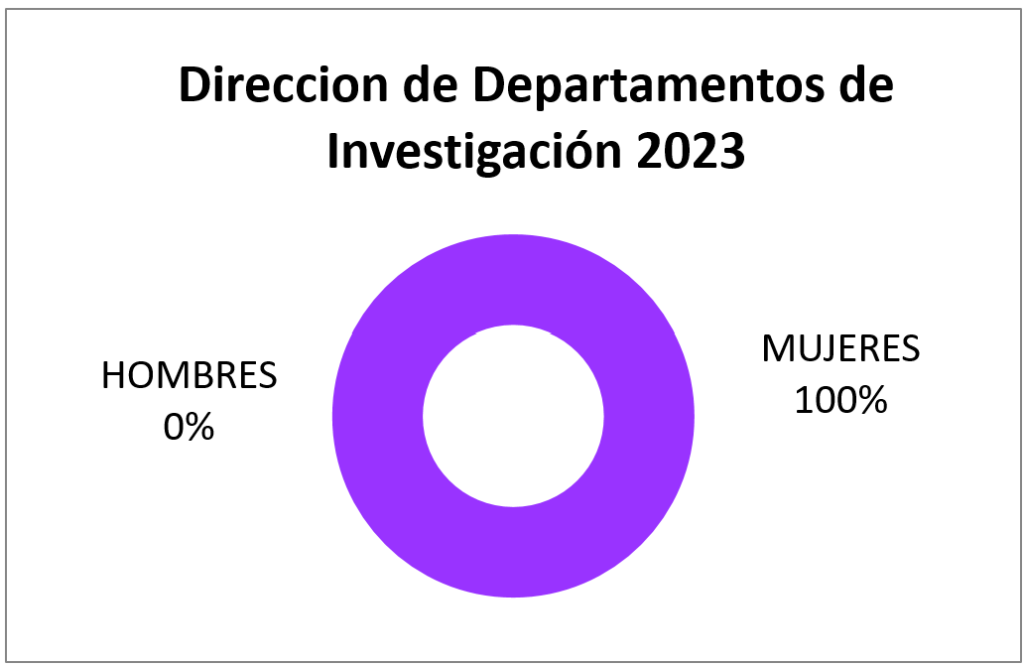
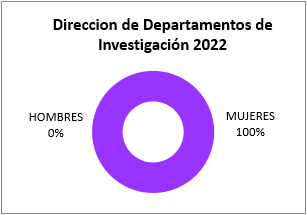
The role and representation of women scientists at the IETcc is particularly noteworthy. Figure 1a shows the scissors graph in the IETcc. It should be noted that 83% of the people in the category of Scientific Researchers are women and 67% in the category of Research Professors.
It is especially relevant to highlight the comparison between the scissors graph of the IETcc (Figure 1a), of the CSIC global (Figure 1b) and the one corresponding to the Area of Science and Technology of Materials (CyTM) of the CSIC (Figure 1c), since it shows that the scissors of the situation of the scientific personnel of the IETcc is inverted.
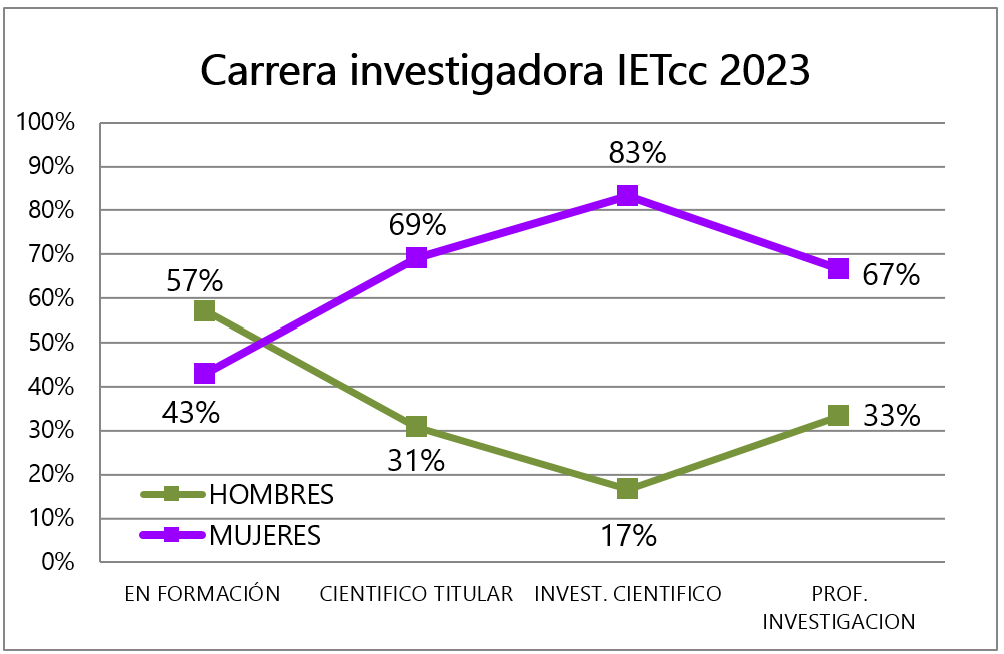
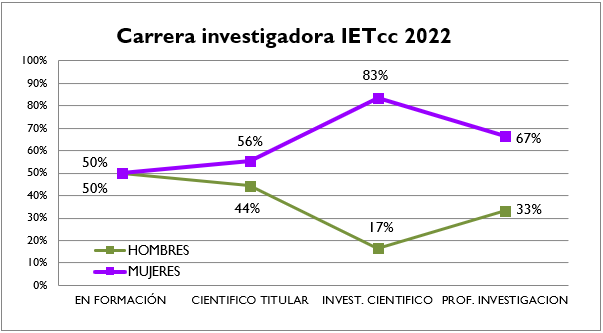
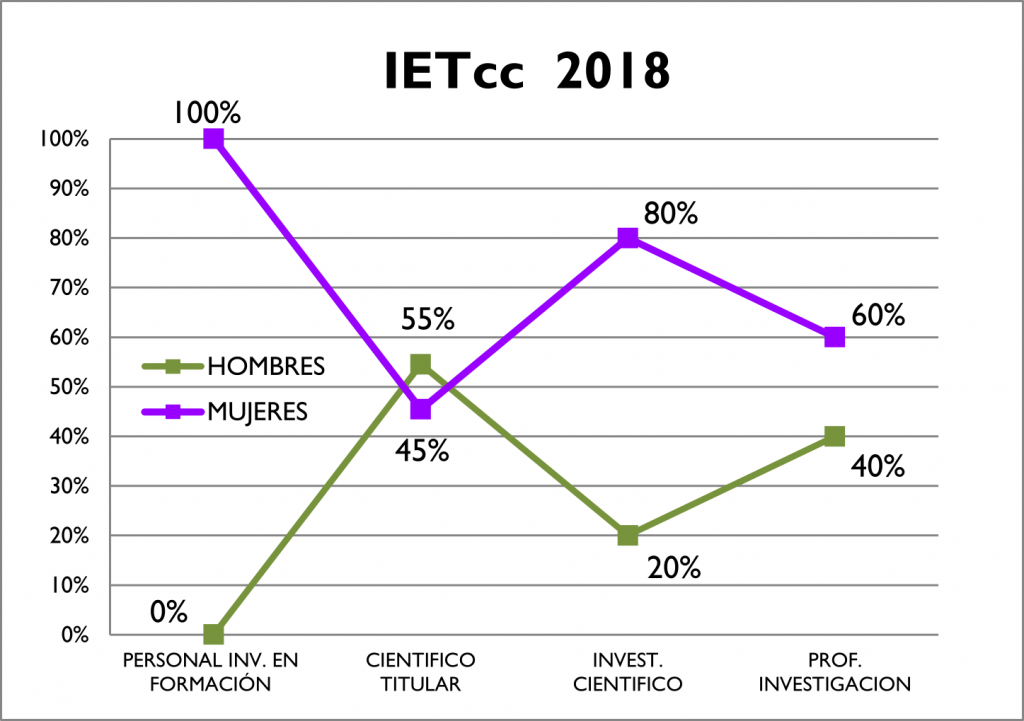
Fig.1a. Scissors graph of scientific staff by gender and levels in the IETcc.

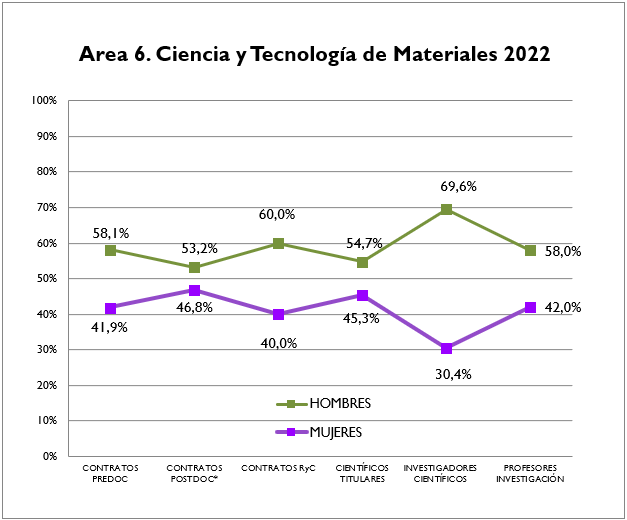
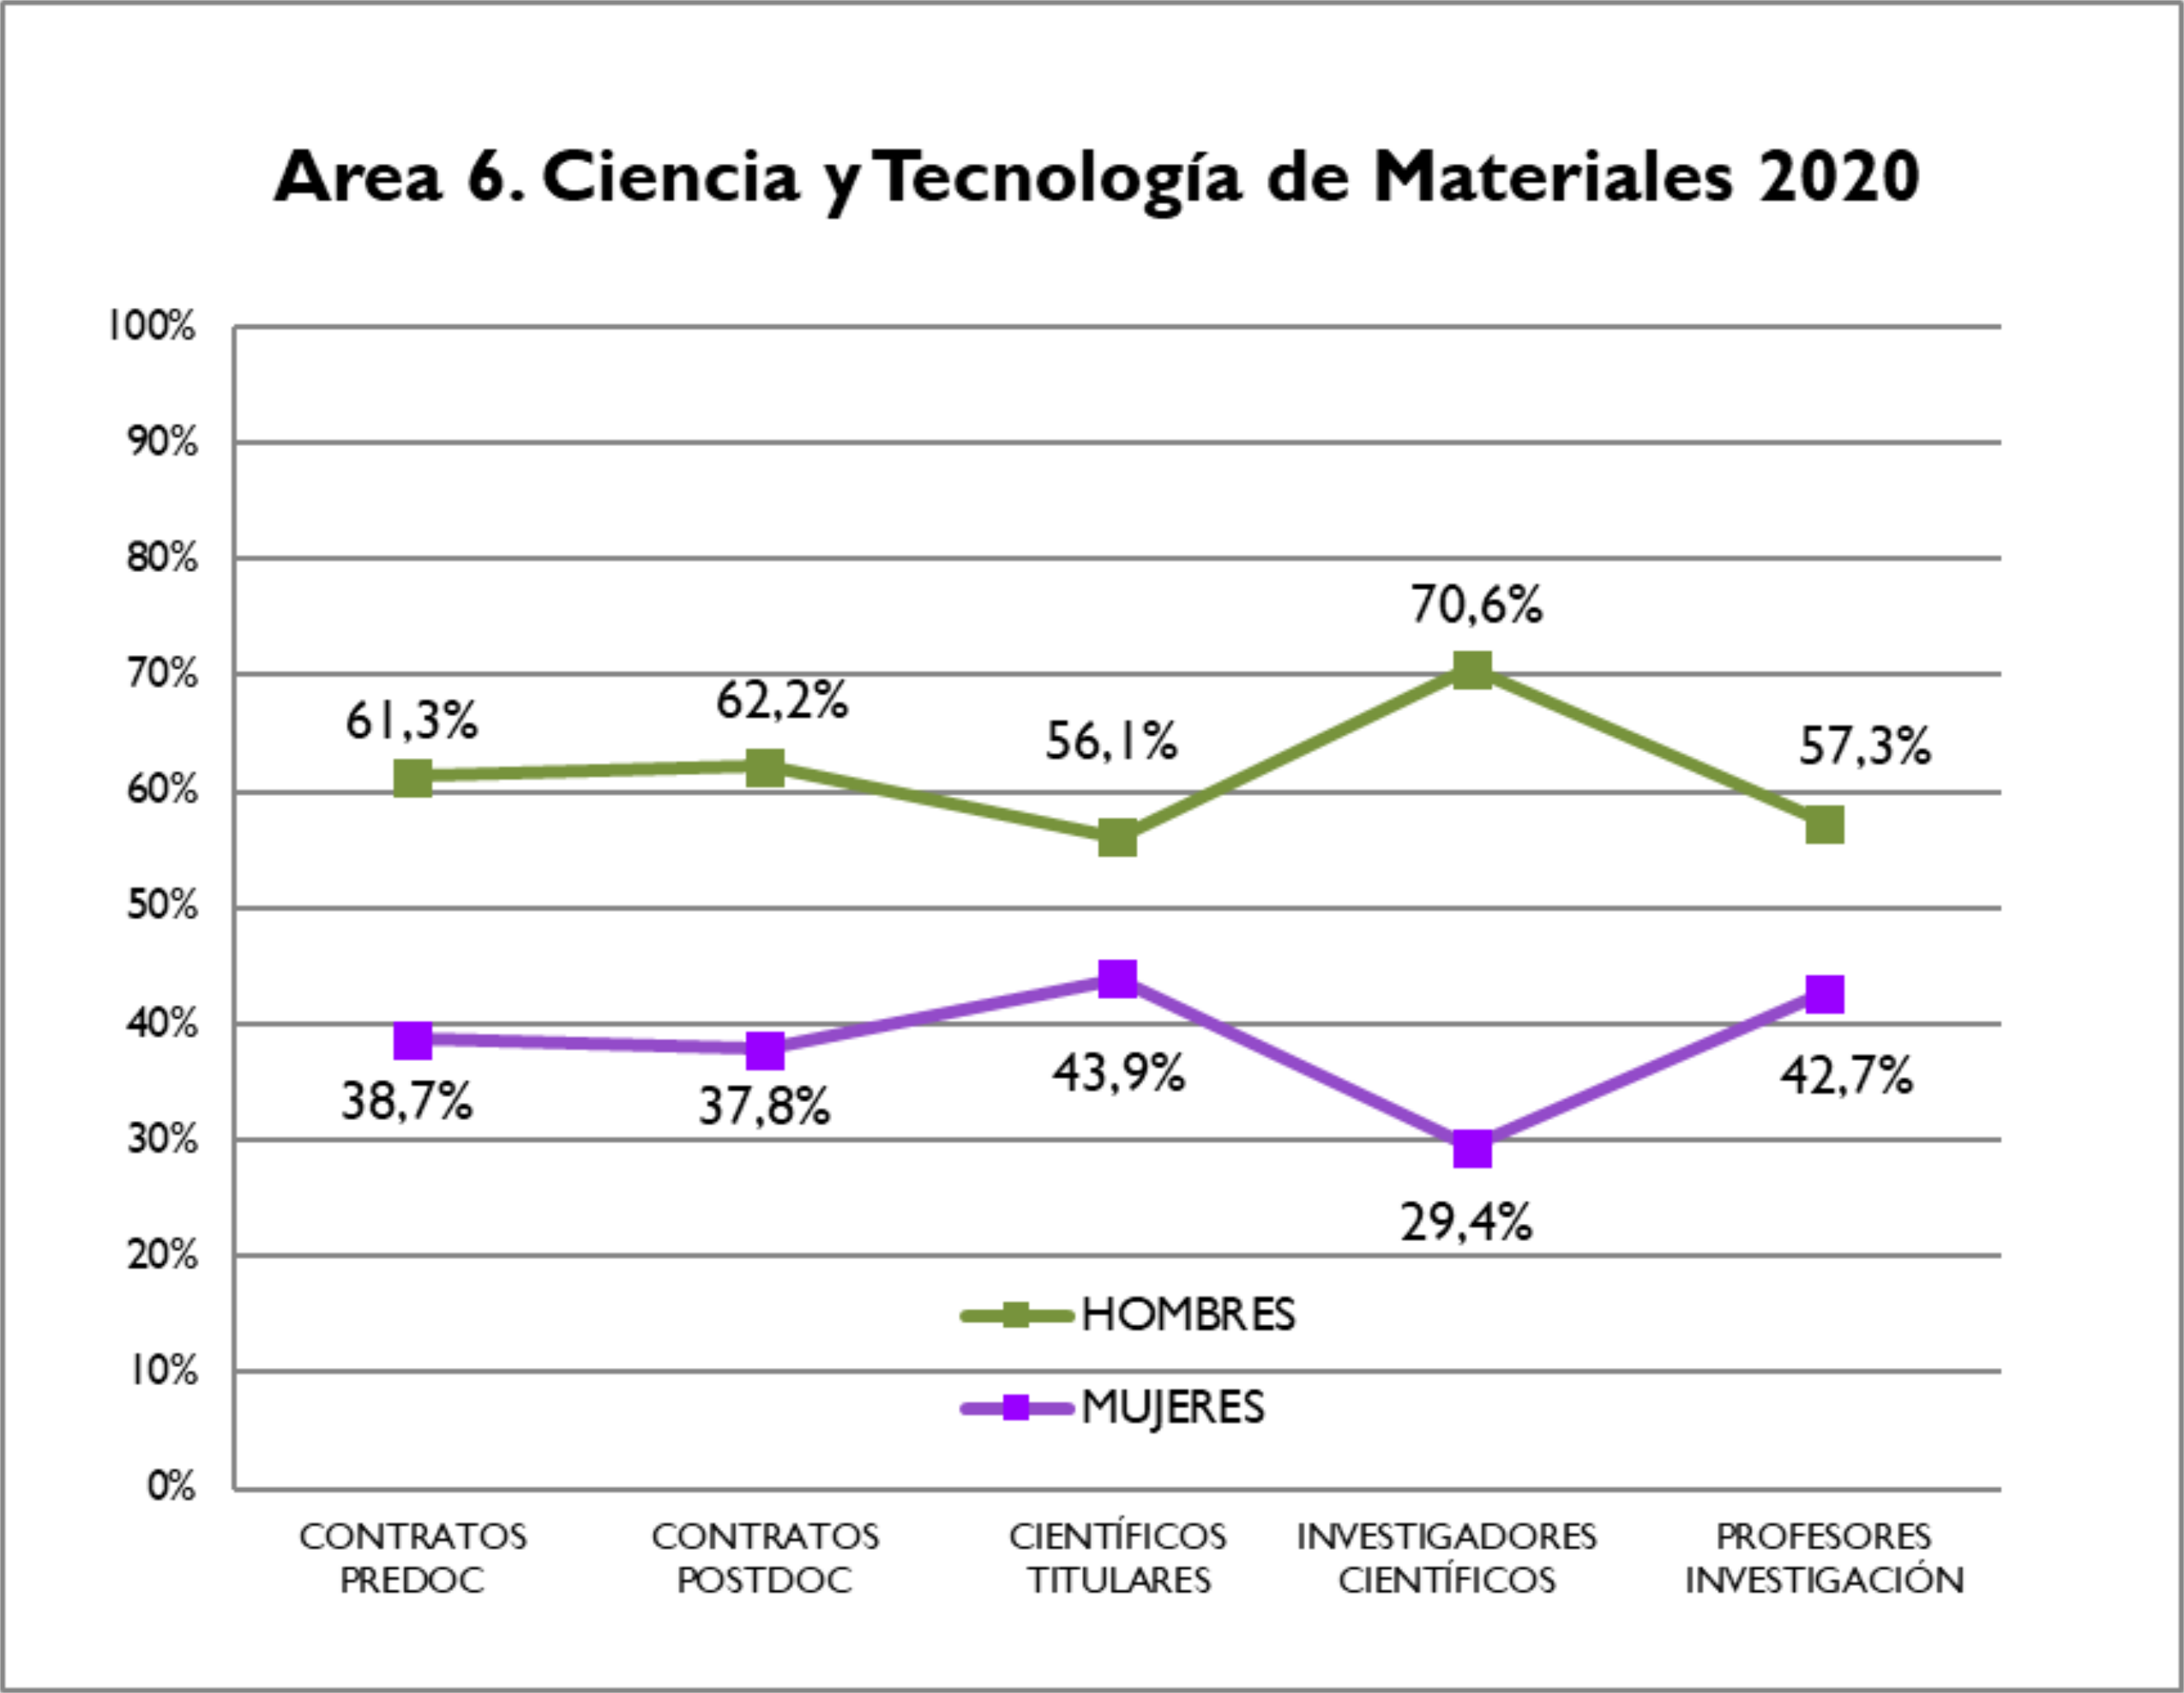
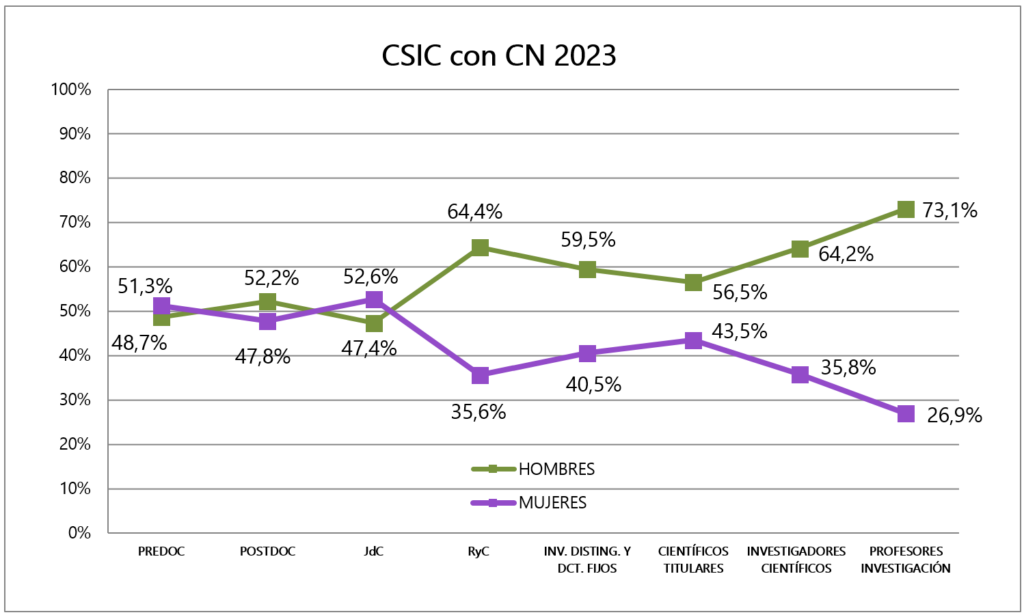


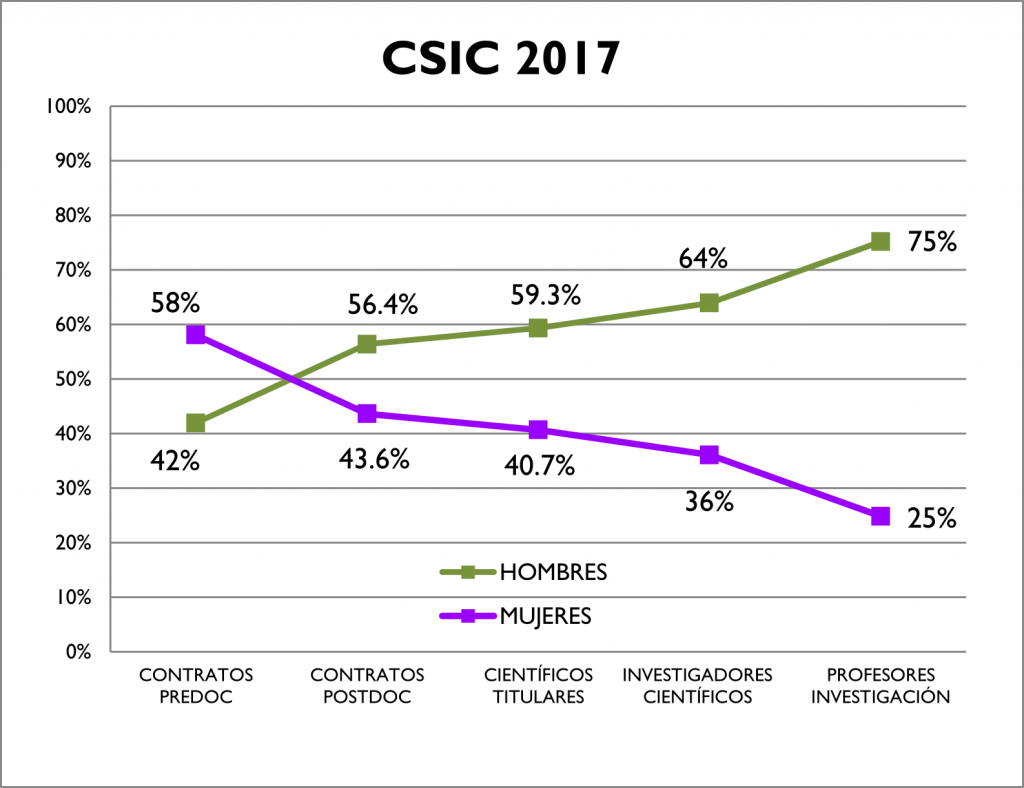
Fig.1b. Scissors chart of scientific personnel by gender and levels in the Area of Materials Science and Technology.
Fig.1c. Scientist’s scissors chart by gender and levels in the CSIC.
The higher proportion of female Research Professors at the IETcc explains the low value of the Glass Ceiling Index which shows that there is no glass ceiling for female researchers at the IETcc:

|
Glass ceiling index in IETcc in 2023
1,09 |

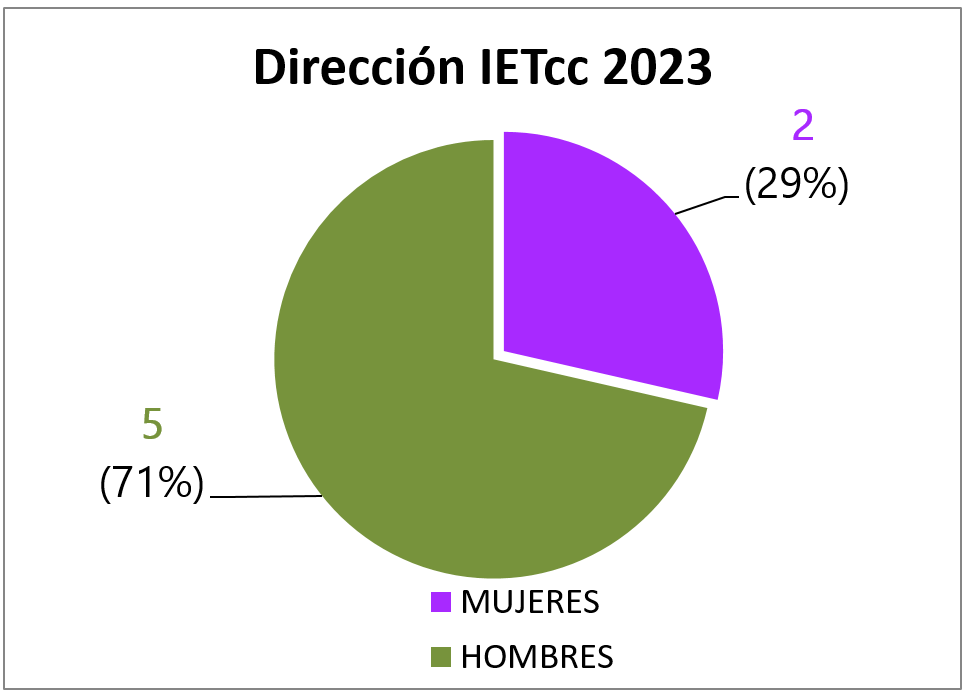
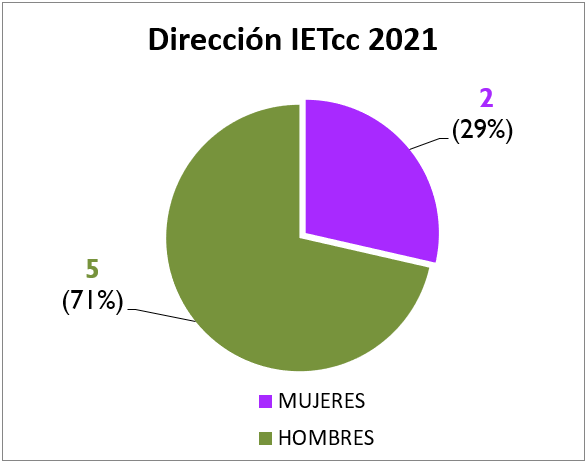
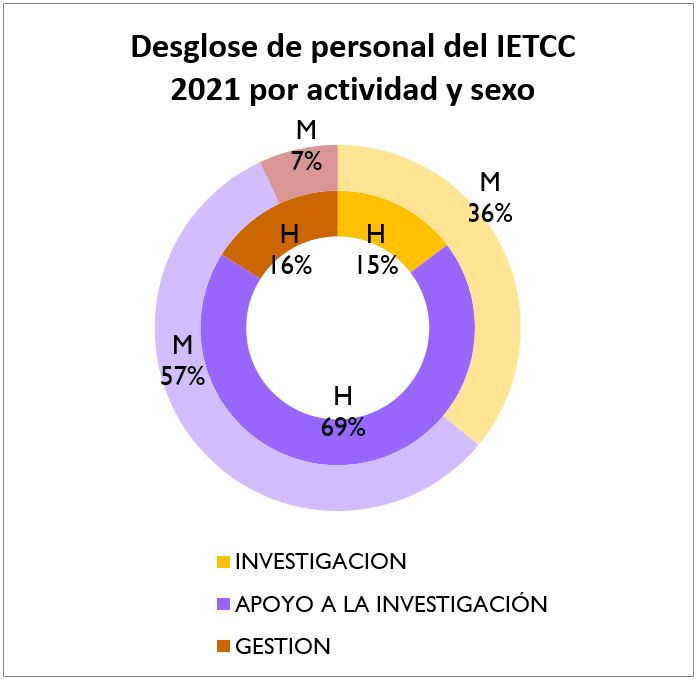
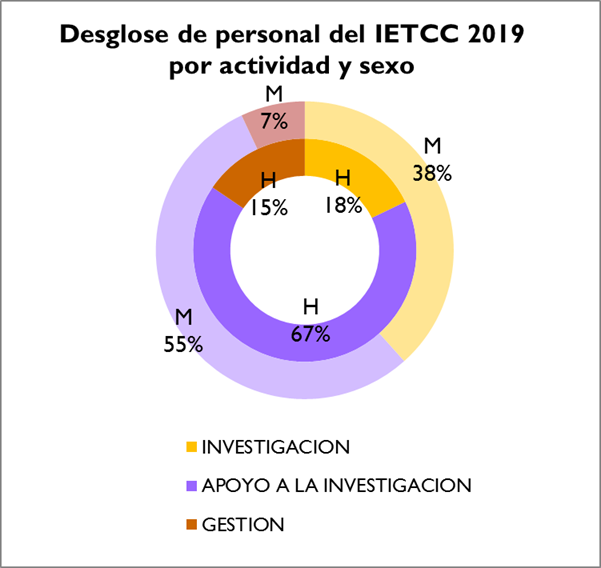
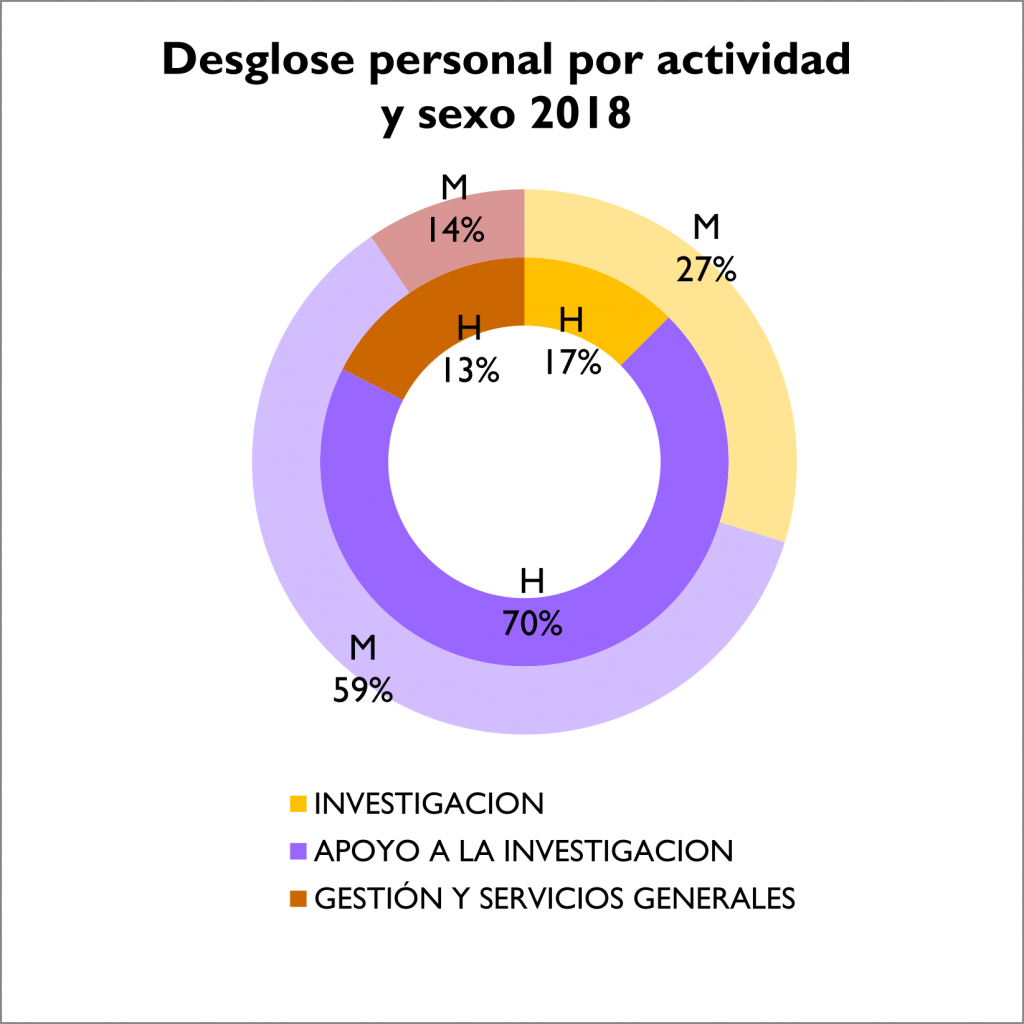
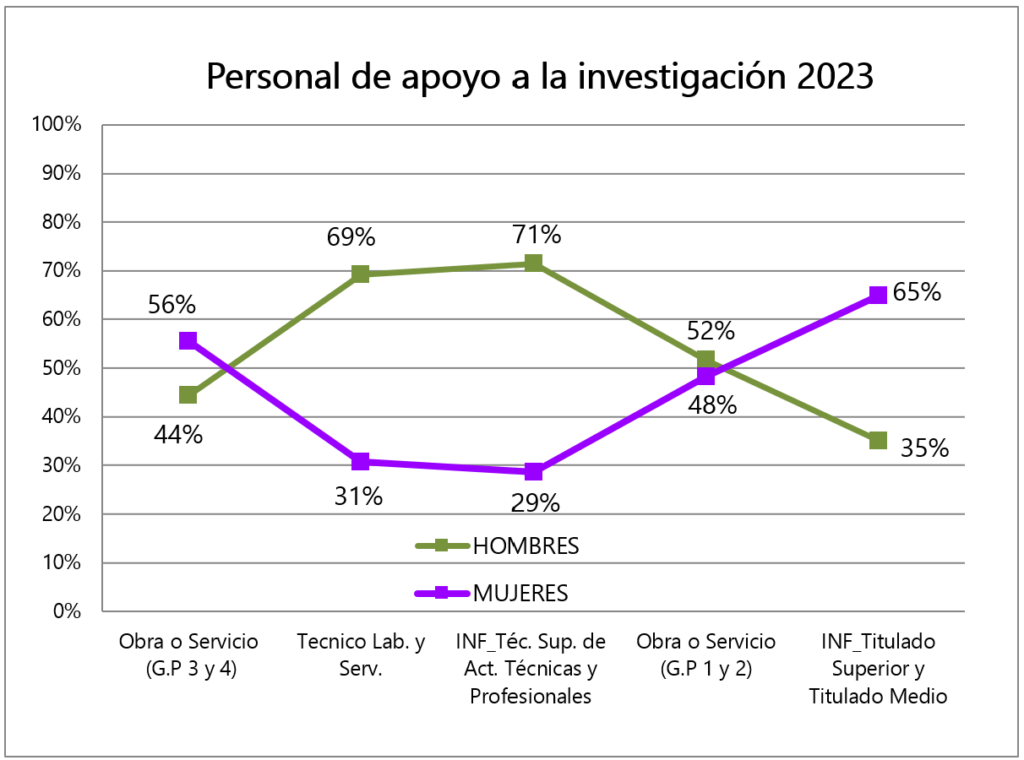
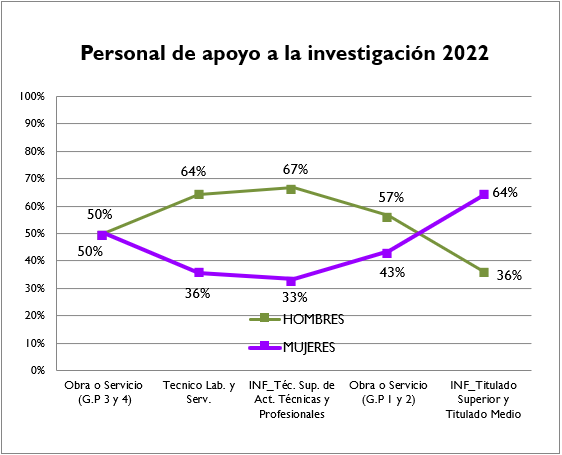
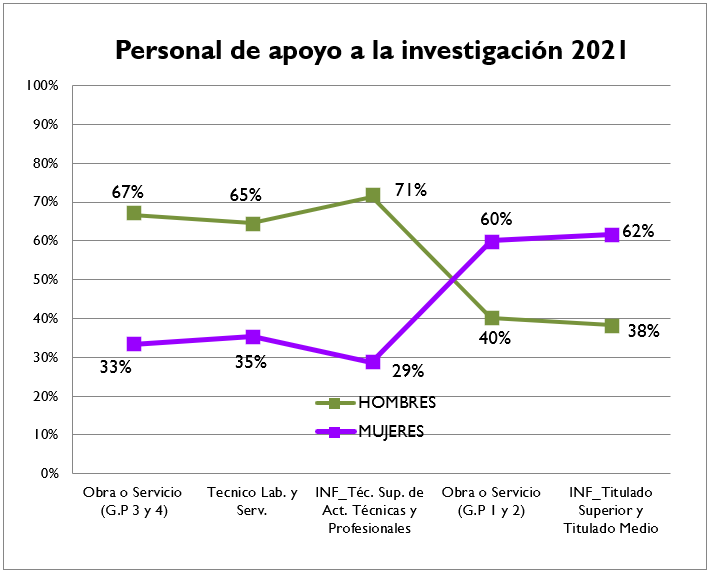
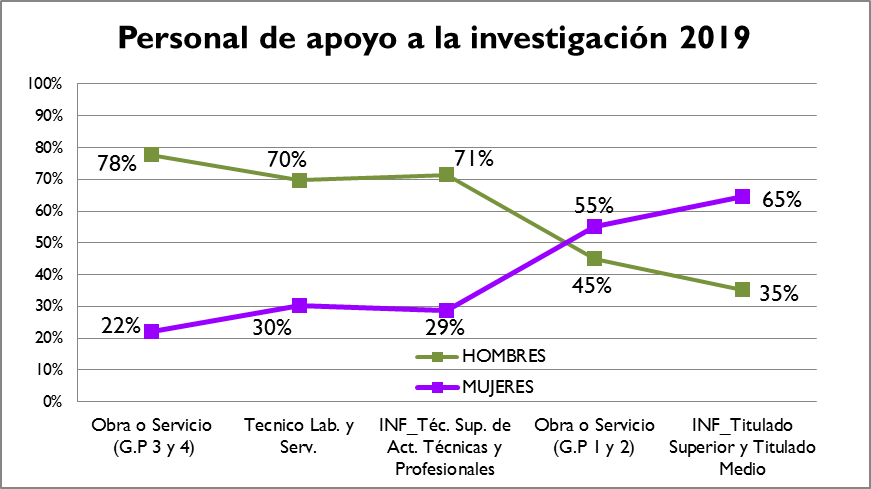
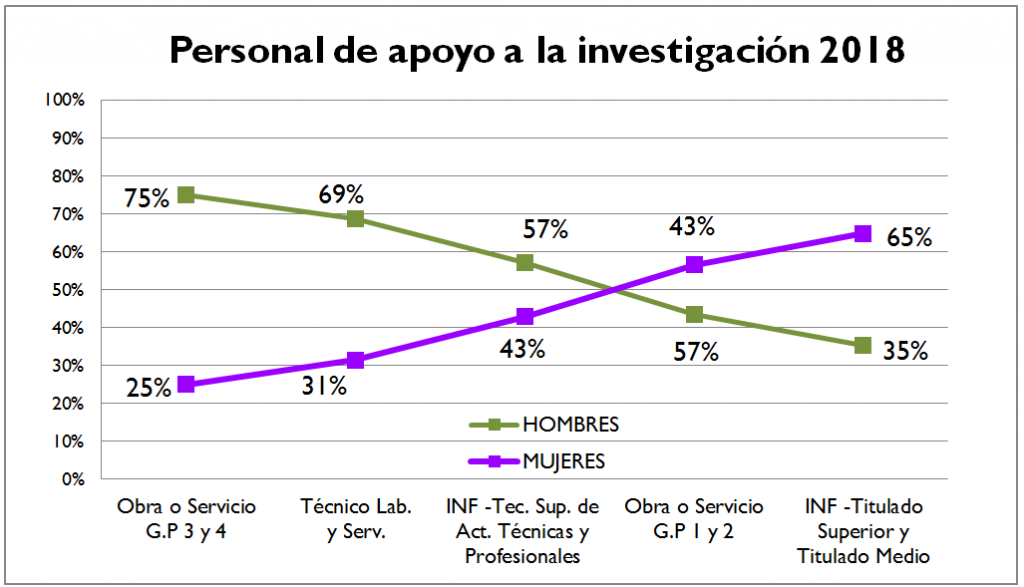
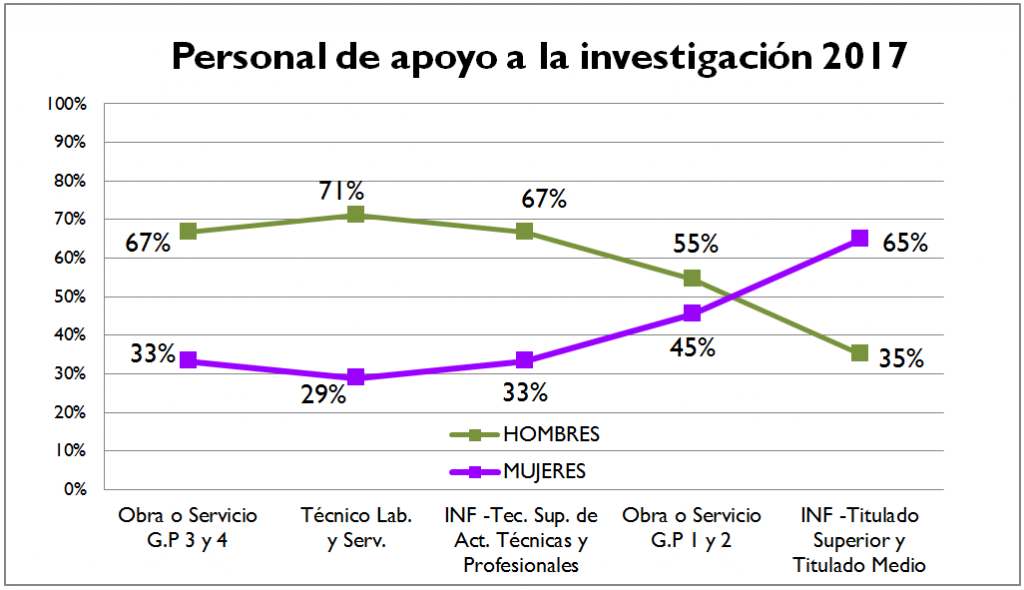
Research support staff

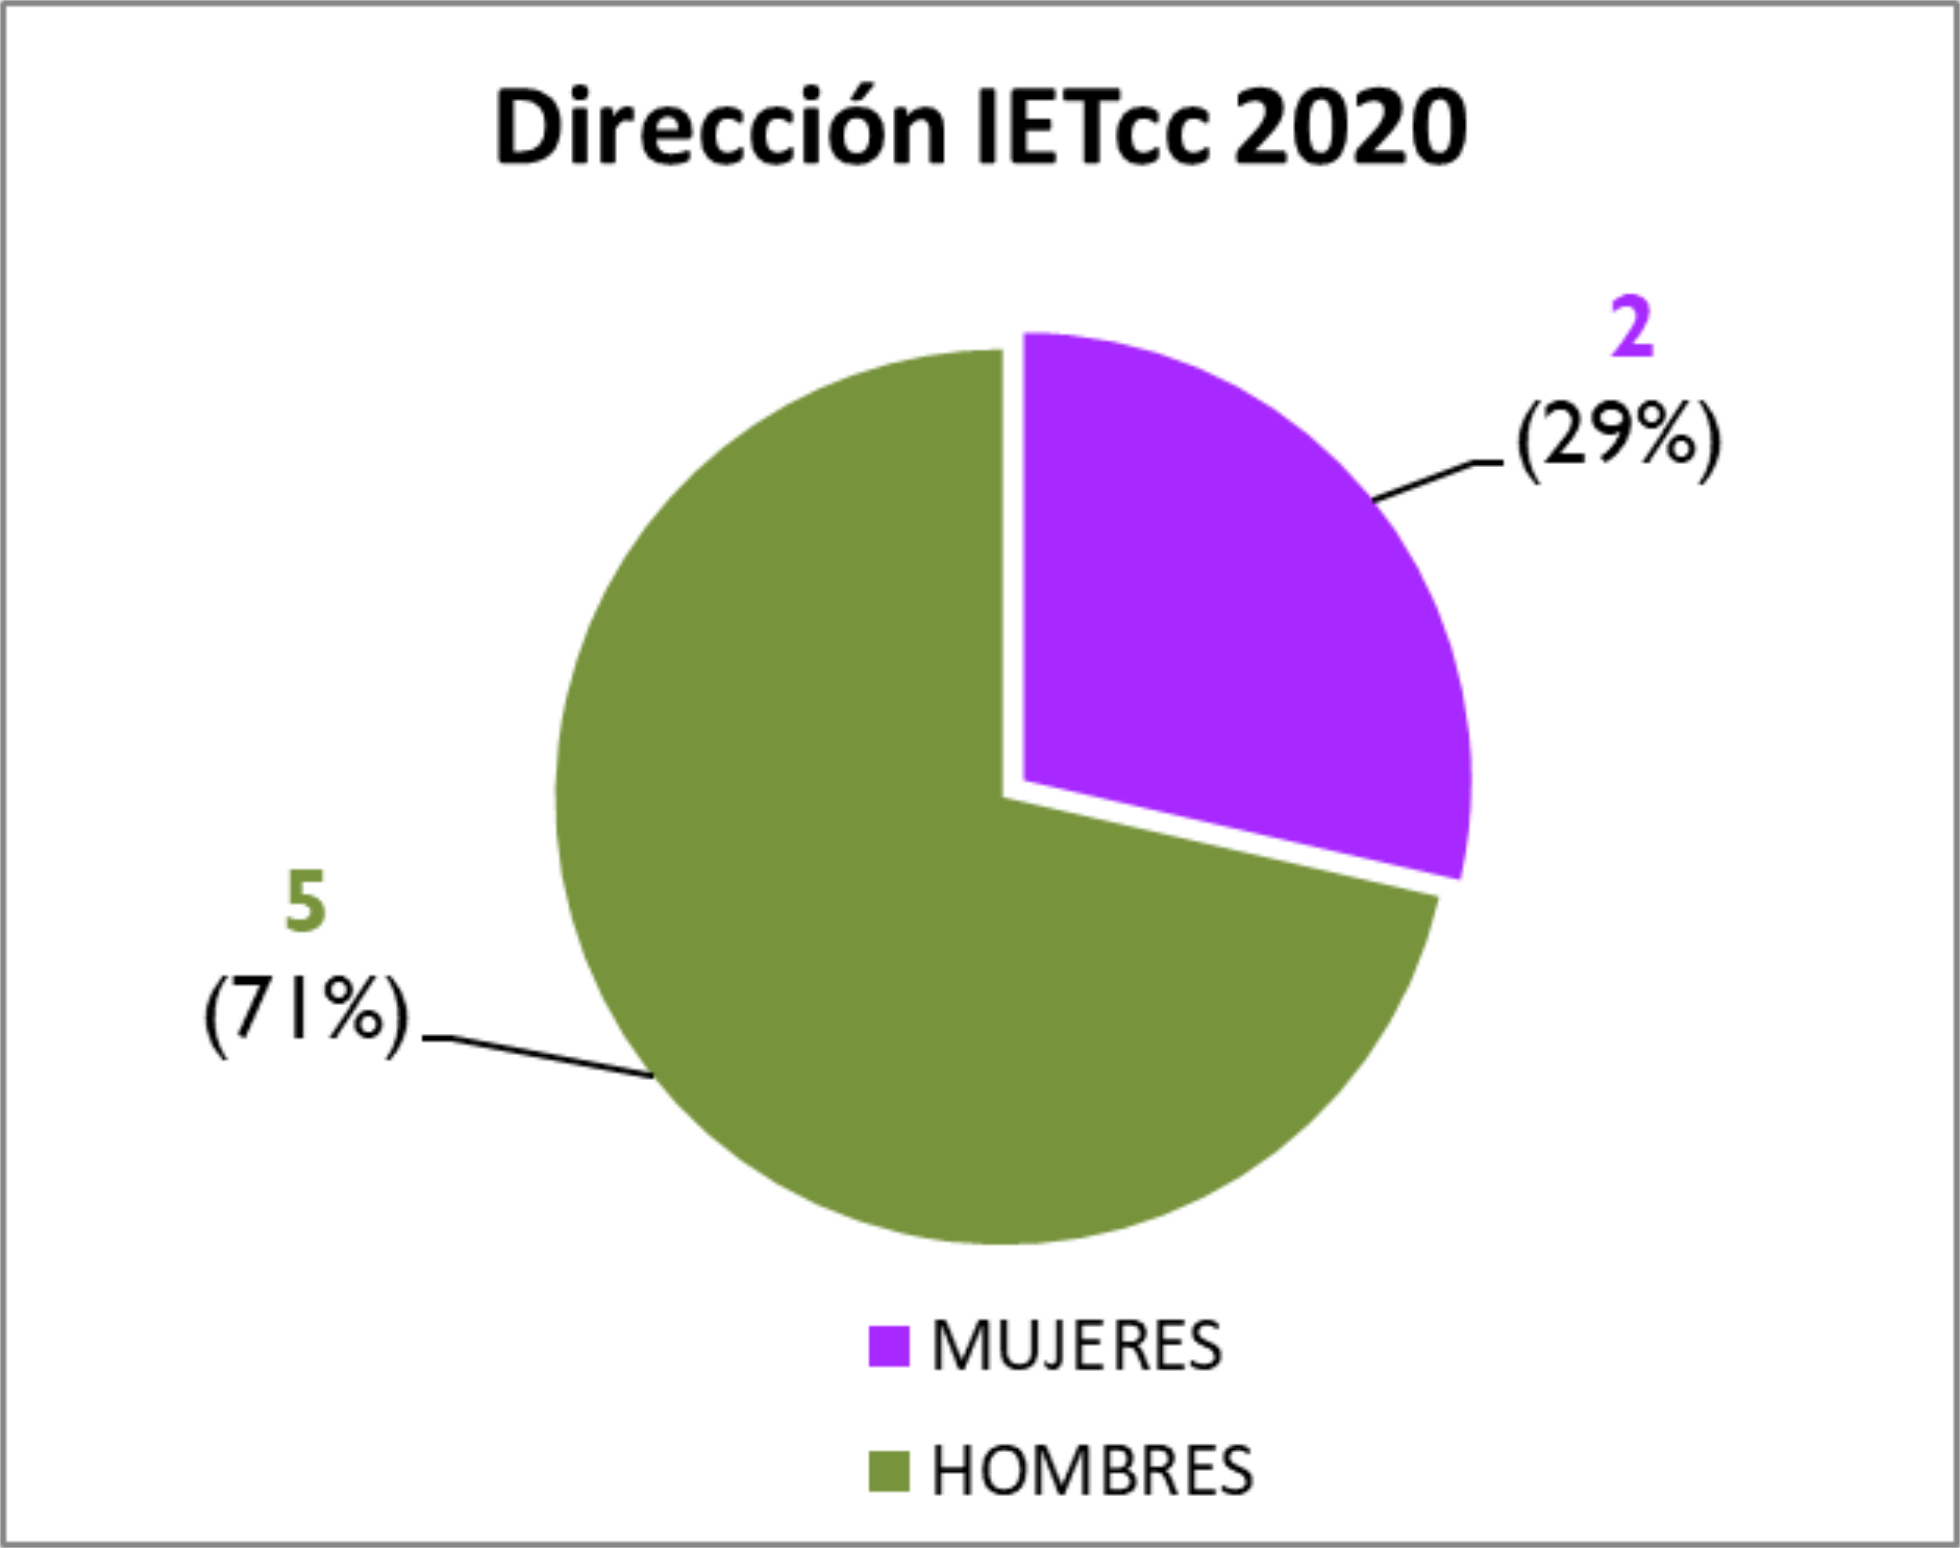
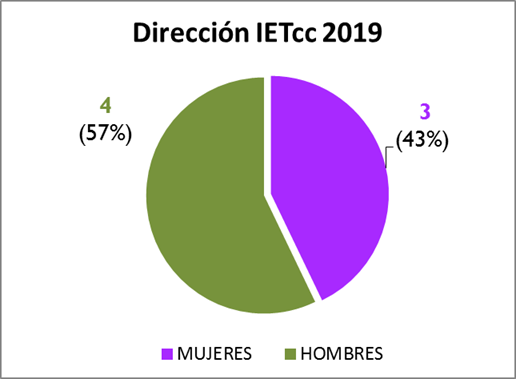
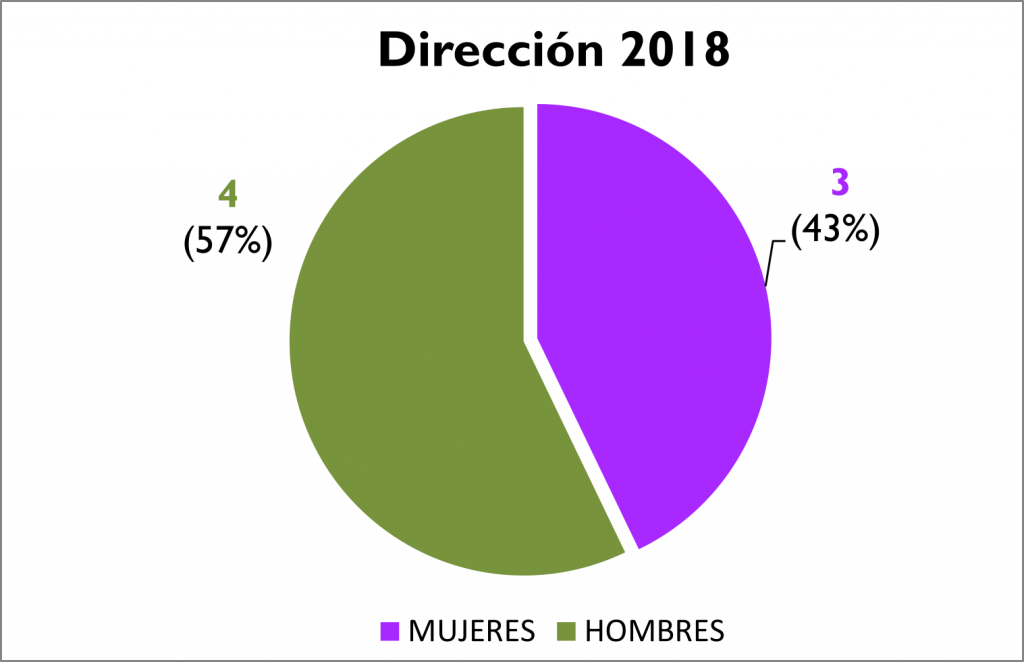
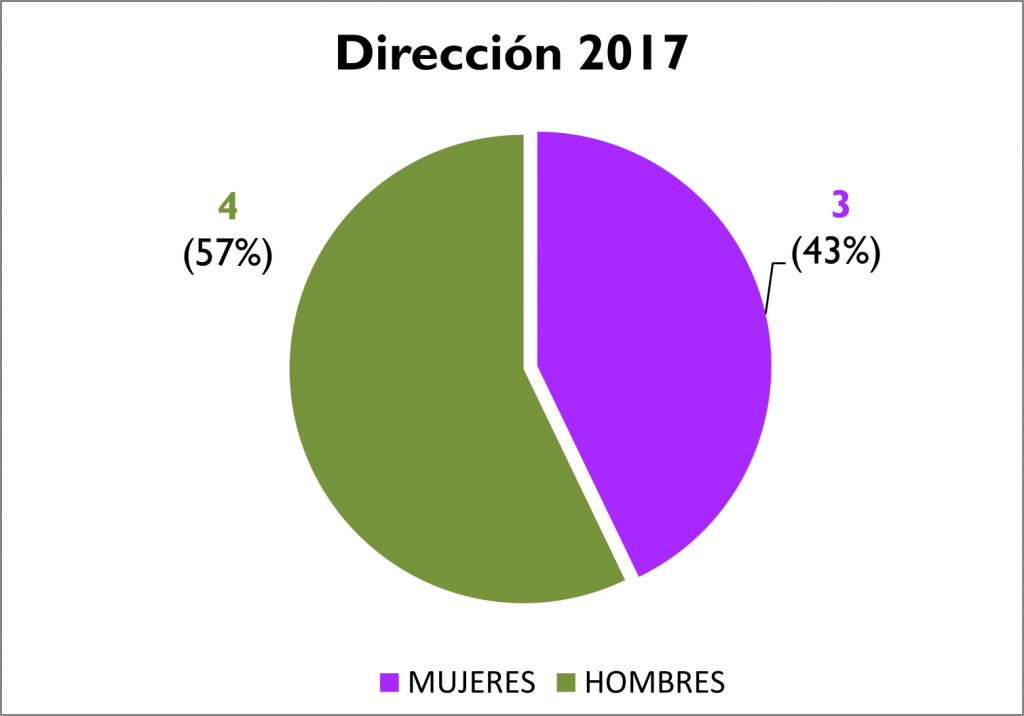
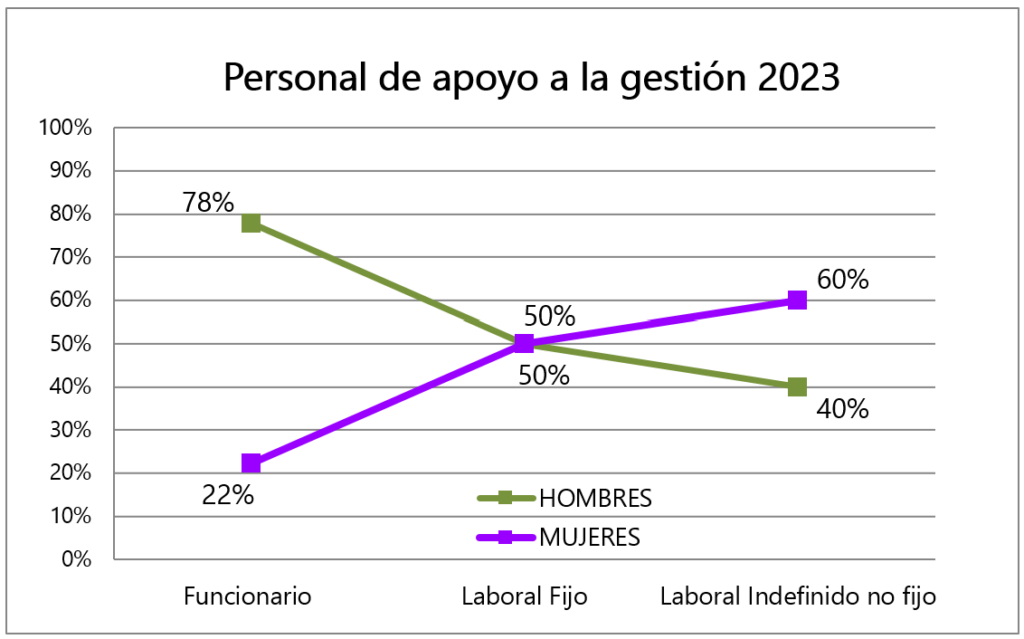
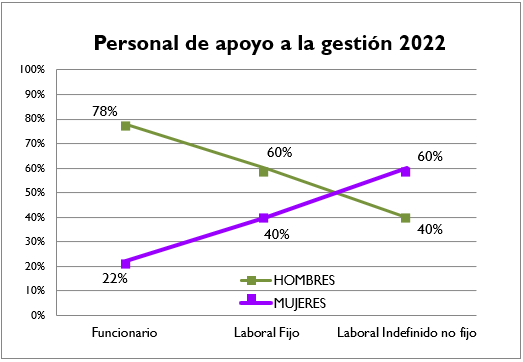
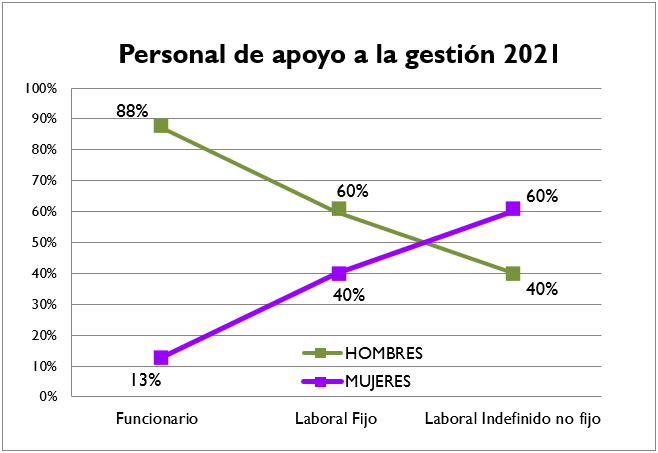
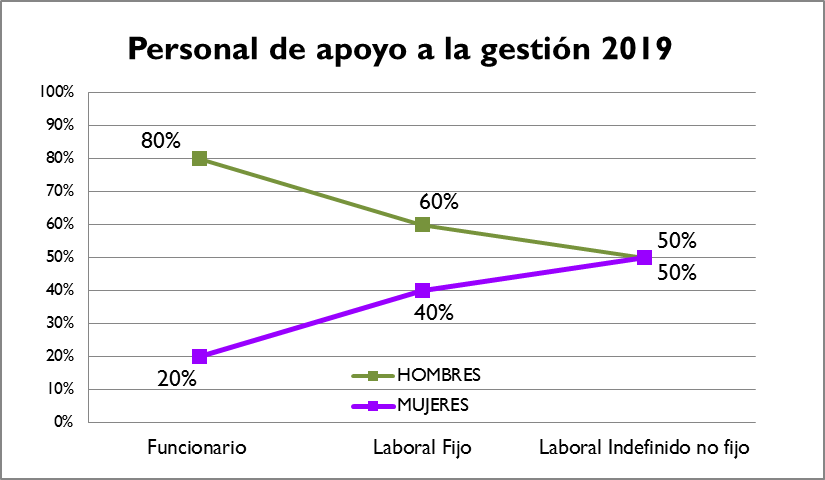
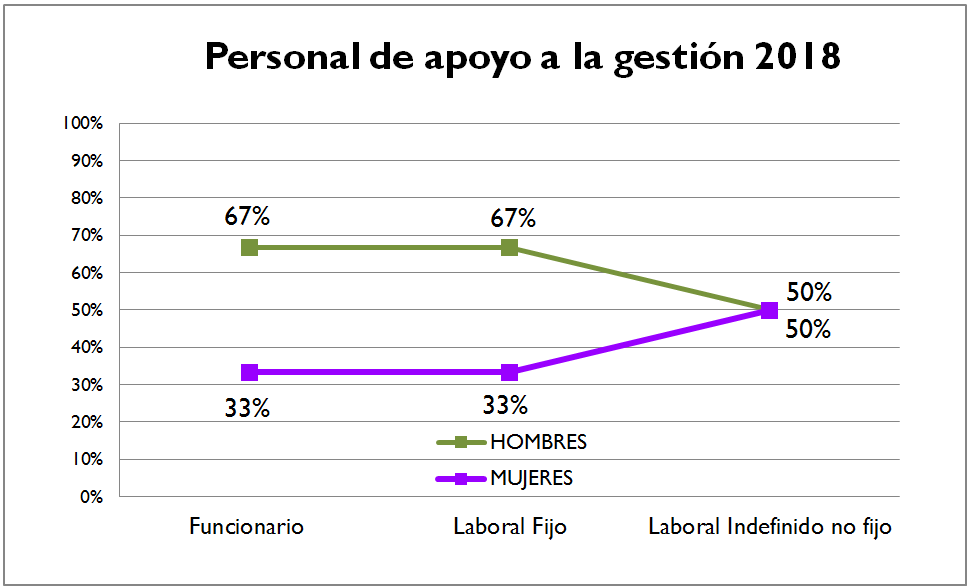
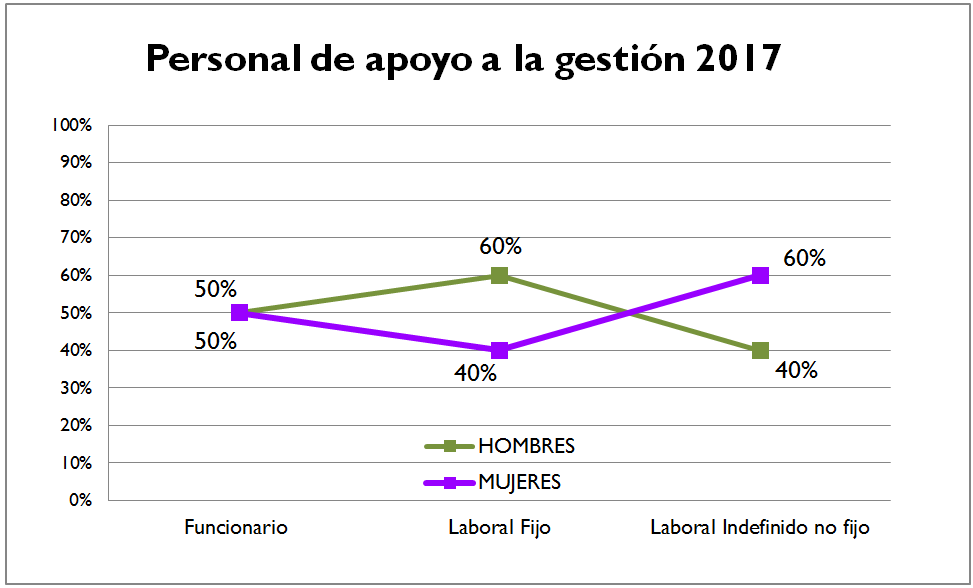
Management support staff
Participation of research staff in research projects
| YEAR 2021 | M | % VS. TOTAL | W | % VS. TOTAL | TOTAL |
| NATIONAL PROJECTS AND OTHERS | 6 | 30% | 14 | 70% | 20 |
| RETOS-COLABORACIÓN PROJECTS | 1 | 33% | 2 | 67% | 3 |
| EUROPEAN PROJECTS | 0 | 0% | 2 | 100% | 2 |
| TOTALS | 7 | 28% | 18 | 72% | 25 |
| YEAR 2021 | M | % VS. TOTAL | W | % VS. TOTAL | TOTAL |
| I+D CONTRACTS | 106 | 82% | 23 | 18% | 129 |
| SERVICE PROVISION | 32 | 48% | 34 | 52% | 66 |
| TOTALS | 138 | 71% | 57 | 29% | 195 |
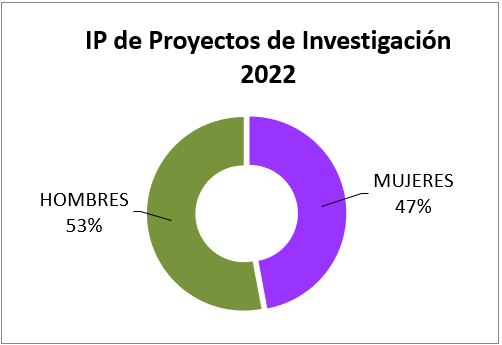
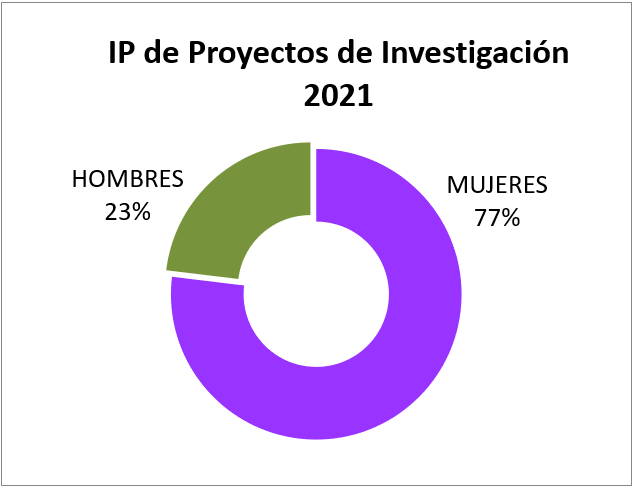
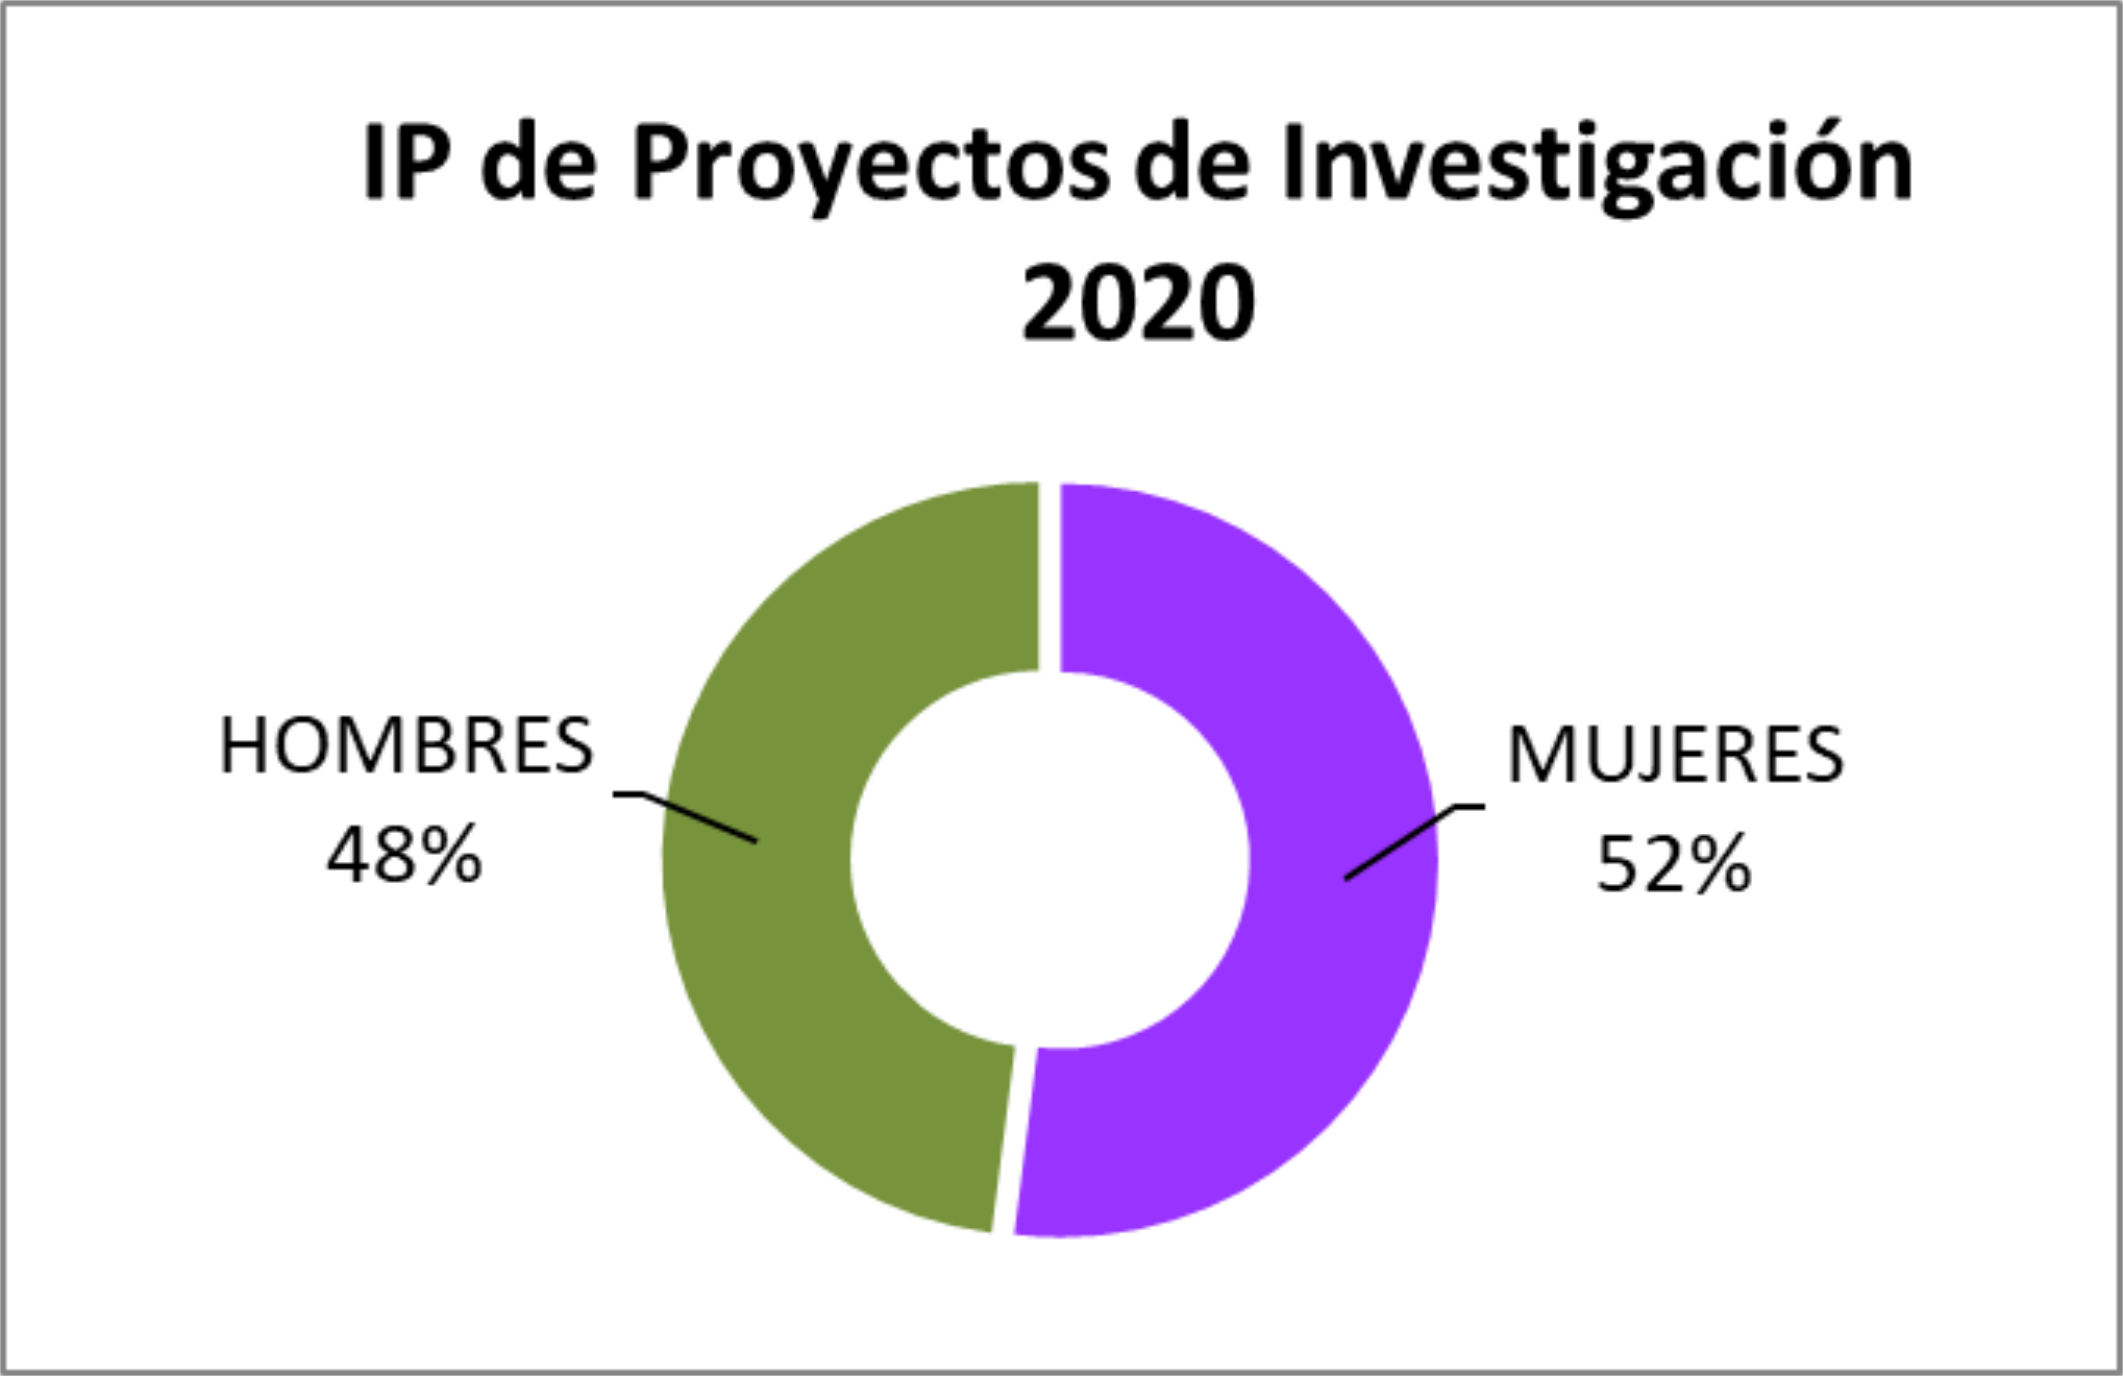
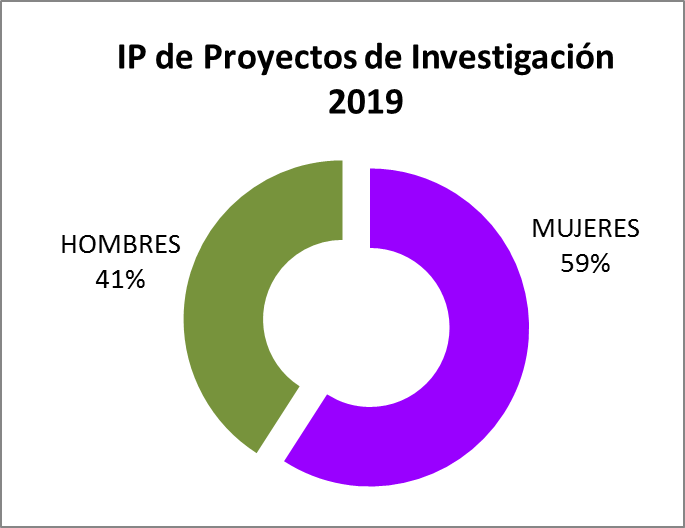
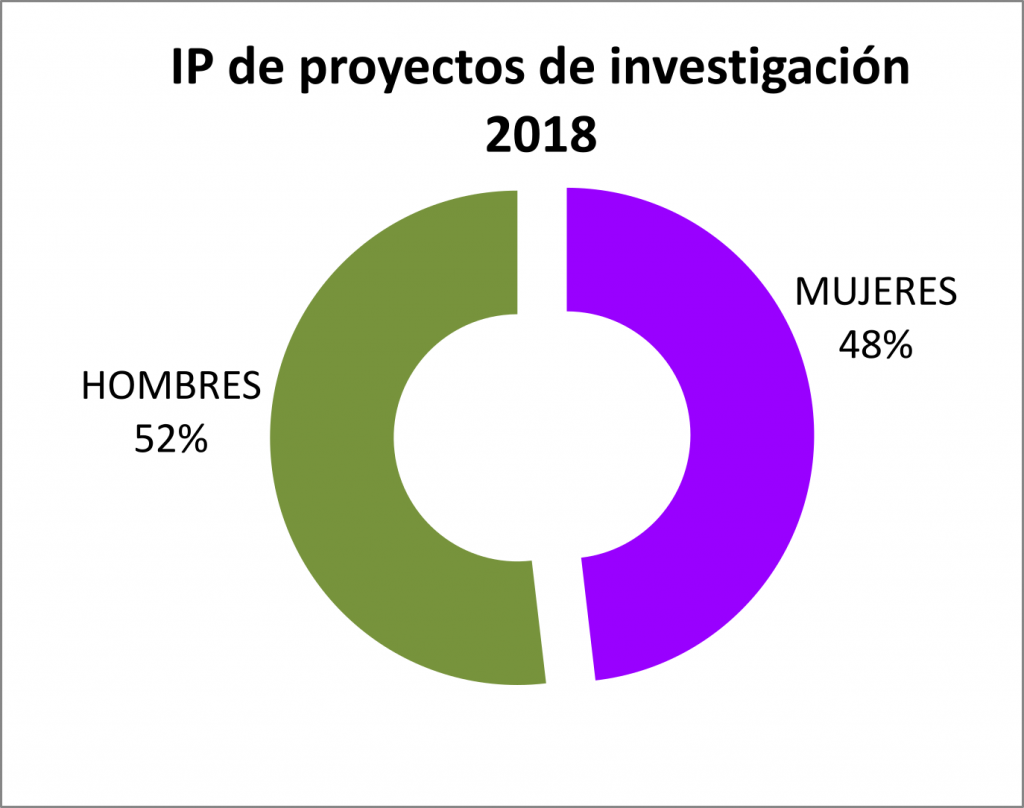
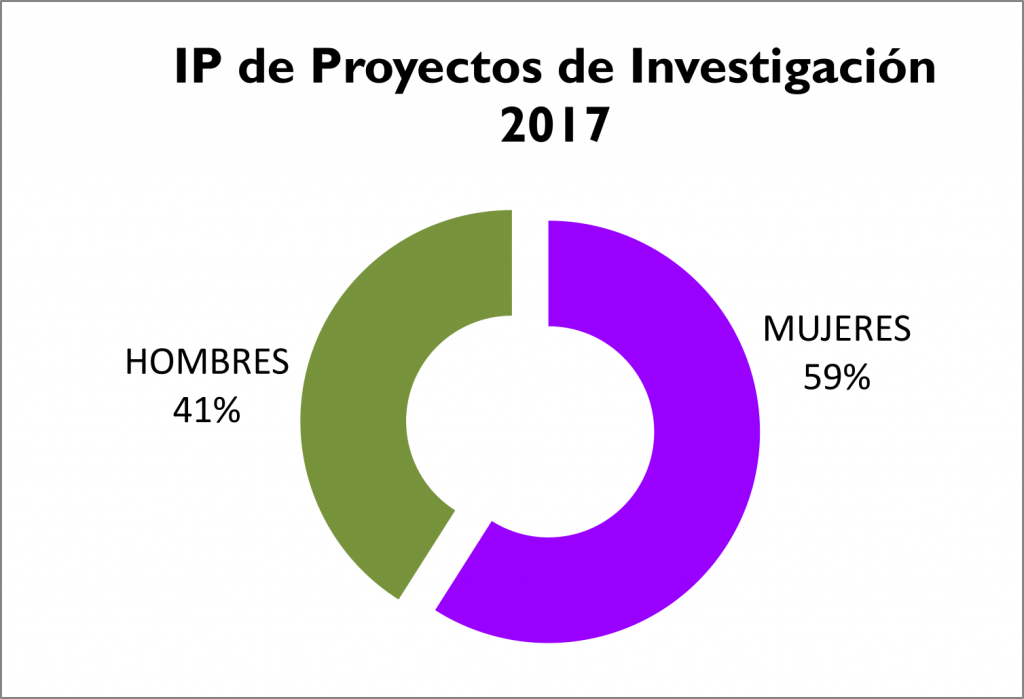
Gender distribution of IPs of research projects in the IETcc